
Monitoring and managing marine farms is crucial in the aquaculture industry and in the conservation of coastal ecosystems. Satellite imagery allows for continuous and detailed observation of these areas, which is essential to optimize production and minimize environmental impact. In this field, convolutional neural networks (CNNs) enable the automatic identification of marine farms from medium-resolution optical satellite images, ideal for capturing large areas with sufficient detail.
Medium-Resolution Optical Images
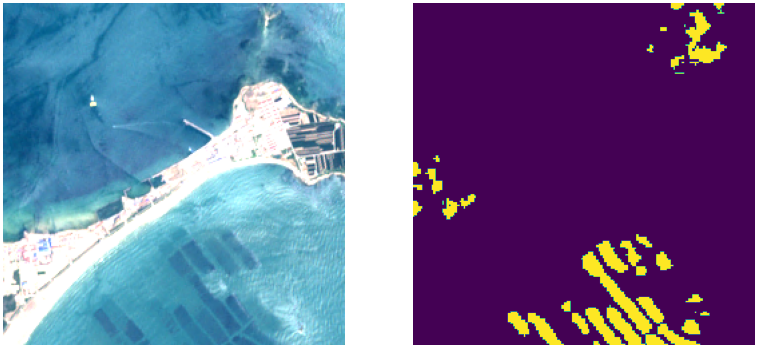
Medium-resolution satellite images, such as those from Sentinel-2with 10 meters per pixel, are an ideal tool for identifying structures in marine areas. Thanks to their multispectral coverage, Sentinel-2 images capture both the visible spectrum and infrared bands, allowing for differentiation of elements in the water based on their reflectance characteristics. This type of imagery facilitates the detection of cages, nets, and other structures in marine farms, distinguishing them from the seabed and other natural elements. By covering wide geographical areas, Sentinel-2 images provide a clear and up-to-date view of areas of interest, making it easier to monitor the development and expansion of farms.
Automated Segmentation Using CNNs
To automate the detection of marine farms, SEDA incorporates segmentation models based on convolutional neural networks. CNNs have the ability to analyze large volumes of satellite data, learning complex visual patterns such as the shape, color, and texture of marine farms. This allows for the identification of specific aquaculture areas and differentiation from natural or artificial elements in the surroundings, such as boats, algae, or calm water formations that may cause confusion.
The CNNs used in SEDA have been trained on a robust dataset that includes various configurations of marine farms, under different environmental conditions and seasons, which enhances detection accuracy.
Results and Visualization in SEDA
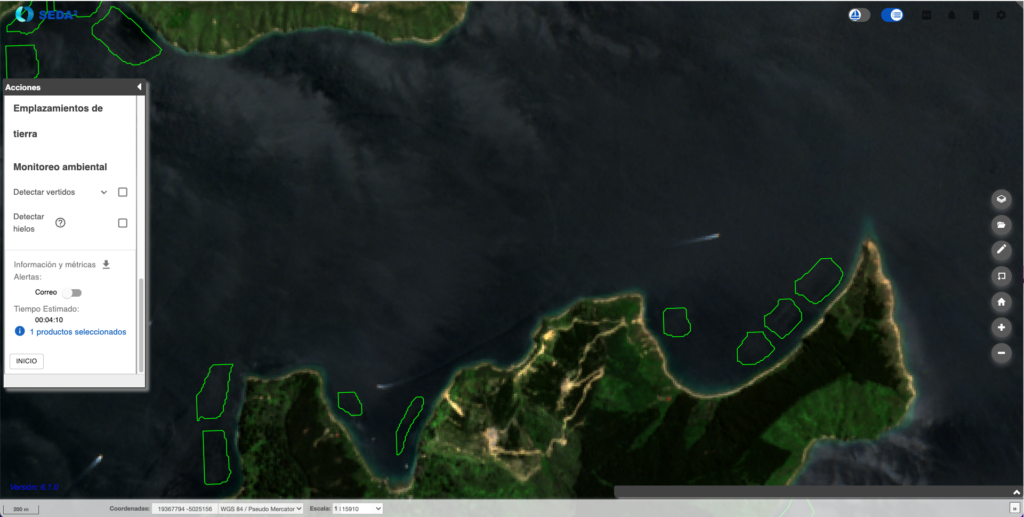
Once the model has processed the images, the results are visualized in SEDA’s Geographic Information System (GIS), where areas detected as marine farms are highlighted with segmentation polygons. This visualization allows operators to review detections, adjust information layers, and compare images from previous dates to analyze the expansion or changes in farms.
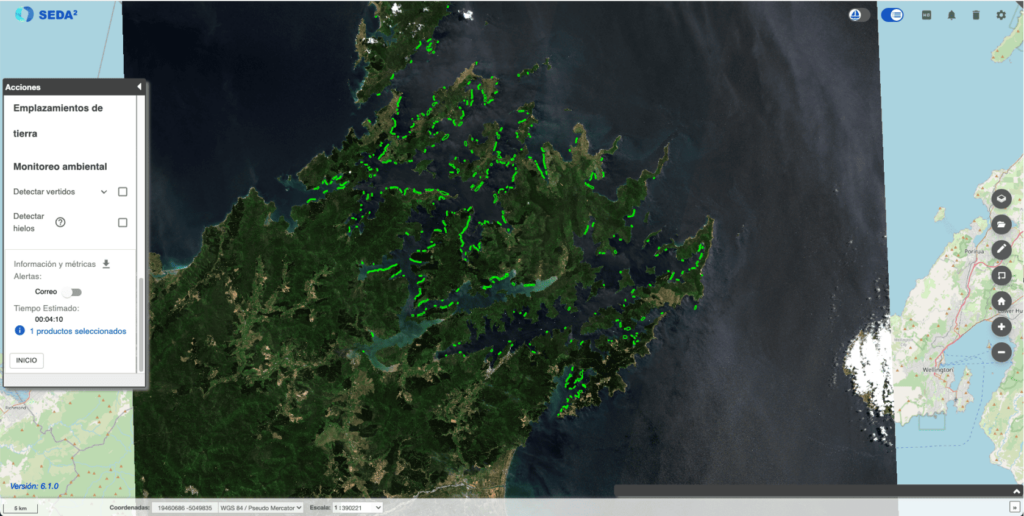
Results can be exported in various formats, including PowerPoint presentations with relevant captures and data about the farms, overlays in KML format for visualization on geospatial platforms, and shapefile and geoJSON files for integration into other systems. Additionally, standardized reports for NATO environments are provided, including ISRSPOTREP and RECCEXREP formats, which enable interoperability with defense and security systems.
Applications
This capability to detect and monitor marine farms has significant applications in the regulation and management of aquaculture. Environmental agencies can use this technology to control the impact of farms on the coastal environment, while aquaculture companies can optimize the expansion of their facilities and track the condition of cages and nets in real or near-real time.
In marine resource management and conservation, the automatic detection of marine farms allows for assessing the sustainability and feasibility of new facilities, as well as planning environmental mitigation strategies.