
The classification or segmentation of land uses consists of Identify the type/use of land corresponding to each region of the imageThe study of land type and cover (Land Use and Land Cover, LULC) focuses on the variation in the content of the planet's surface (vegetation, land, or water), together with the changes in it due to human action (crops, buildings, quarries, etc.).
The automation of this task has applications of interest in different areas, such as crop monitoring, environmental change studies or speeding up cartographic analysis and improving the strategic planning of military deployments on land. This implies a considerable reduction of time and costsnecessary for the analysis and processing of images that cover a large amount of terrain, allowing for rapid and efficient decision-making.
Input and model characteristics
The LULC segmentation model uses VHR (Very High Resolution) optical images, seeking to rely on the finest details to differentiate between classes that are already very similar to each other, such as "ploughs", "crops" or "pastures". These different types of terrain are not only similar to each other, but there are also many varieties of soil included in each of them; this low interclass variance and high intraclass variance constitute one of the main challenges for this type of analysis.
In SEDA a model based on Convolutional Neural Networks (CNN) to segment into 13 different classes, including those previously mentioned "urban land", "water", "forest" ... trained with combined images of different datasets of different areas of interest; LCLU models trained with very high resolution images are usually especially dependent on their location, sometimes requiring retraining for correct operation in areas with rough terrain.
Model outputs
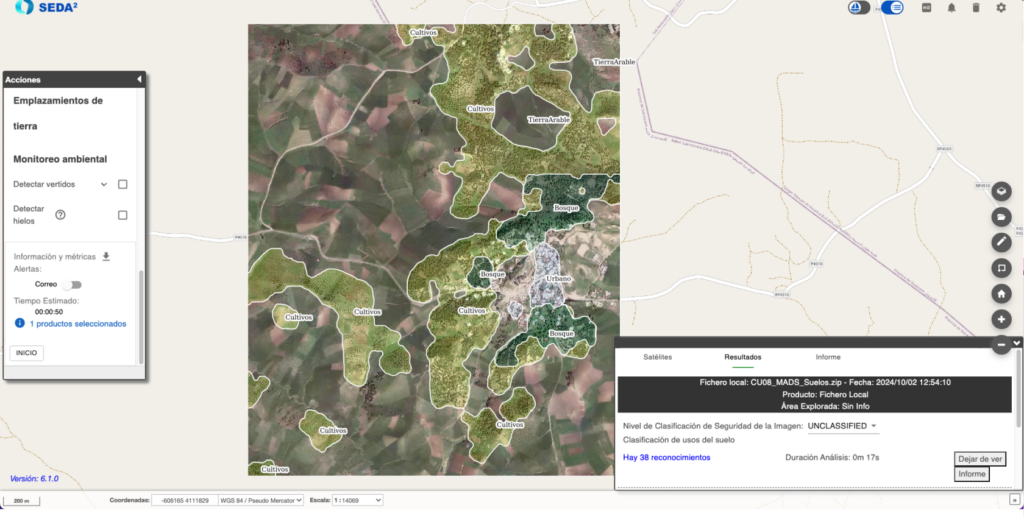
SEDA automatically processes the output mask of the model to achieve a smoother result in accordance with the defined requirements. Subsequently, the different areas identified are converted to shapefile format to facilitate export and use in other tools. We can see an example of a prediction in Figure 1, where regions with different land uses appear grouped under the same color with a certain opacity and a label indicating their corresponding class. The model achieves the objective of grouping regions with the same type of land at a general level, without looking for the exact value in each pixel of the image.
In addition to representing the results overlaid in your GIS viewer, SEDA provides the results in formats such as shapefiles además de otros tipos de formatos oficiales utilizados en el entorno OTAN, como ISRSPOTREP and RECCEXREP. The analyzed image converted to NSIF, a format designed for the exchange of images and related data in defense and intelligence environments. The versatility of these formats allows the Integration of SEDA results into other platforms and geospatial analysis systems, both civil and military.
Applications
Automation of LULC analysis has applications in various fields. It is widely used in the environmental management and urban planning, as it allows monitoring of changes in land use and land cover over time, essential for ecosystem conservation and natural resource management.
In the field of defense it is crucial for the Reconnaissance and strategic surveillance. It enables the identification and monitoring of land uses that could indicate potential threats, as well as providing detailed terrain information for tactical and logistical operations, improving the response capacity in critical situations.