
Segmentation of sea ice concentrations
The prediction of ice concentrations consists of the SAR image analysis in polar areas for the identification of ice densities in areas of large frozen water bodies, thus allowing informed route planning through these areas, avoiding possible changes to the itinerary or damage to vessels.
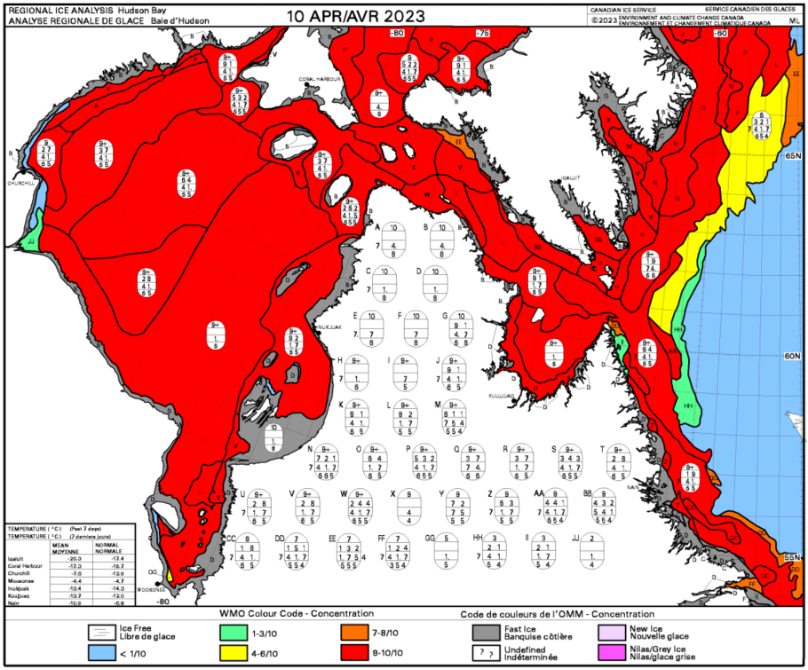
Traditionally, ice charts such as the one shown in Figure 1, published by specialized institutions, have been used for this task. They provide information on the properties of ice and its concentration. The automatic extraction of this information is especially relevant due to the slowness, cost and dependence on specialized personnel in the study of ice, which, added to its dynamism and the need to have updated information quickly, justifies the need for an automated approach that provides information in real time, allowing faster and more efficient decisions.
Input images (SAR)
The study of ice is carried out through SAR (Synthetic Aperture Radar) images, which present information from the bounce of microwave pulses sent by the sensor off the Earth's surface. While optical cameras require sunlight, SAR sensors generate their own signals in frequency bands capable of penetrating clouds and other adverse weather conditions, common in polar areas of interest.
Particularly for ice analysis, EW mode SAR images present HH and HV polarization pairs that are especially reflective on the ice surface, making them the most suitable for this type of studies. For their implementation in SEDA, SAR images are processed following a state-of-the-art procedure for the noise removal and artifact correction that may distort the quality of the data, ensuring that the information used by the model is accurate and reliable.
However, in the specific case of ice segmentation, some limitations arise due to the influence of environmental factors such as wind or ice melting, which causes the reflected energy to be partially dissipated and the information detected back on the radar to be reduced.
Output of the Artificial Intelligence model
SEDA includes a solution based on Convolutional Neural Networks (CNN) to analyze SAR images, producing an output detailed map of sea ice concentration at each pixel, using a scale of 0/10 to 10/10 just like in the ice charts. The generated map provides a clear and immediate view of the ice situation in large areas. We can see an example of an output from the model already implemented in SEDA in Figure 2,
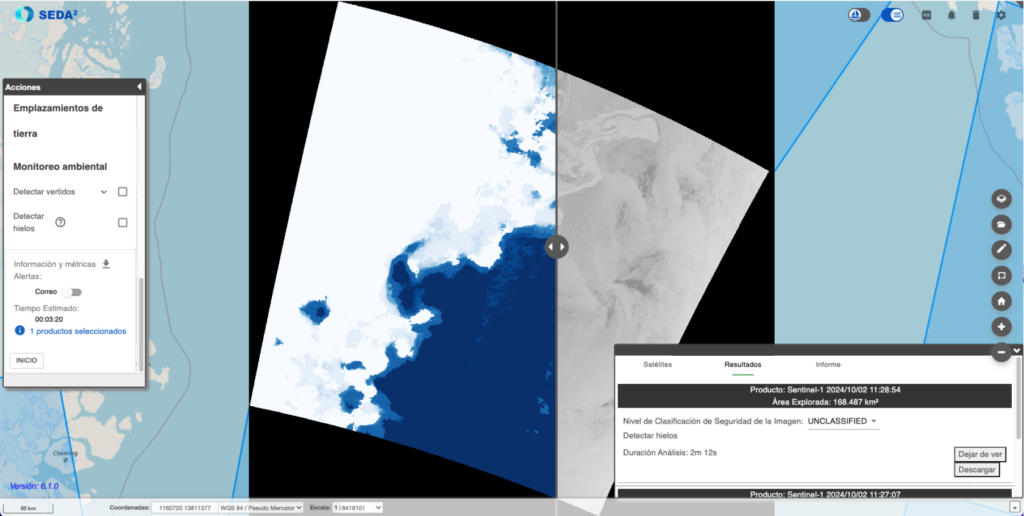
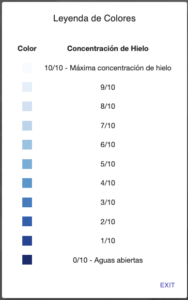
Following the color legend shown in Figure 3, areas with higher ice concentrations appear with a whiter tone than open water areas, indicated in dark blue. The generated map can be downloaded from SEDA obtaining a TIFF file, thus being able to load the result into other GIS viewers or tools of interest.
Conclusion
With the information provided by SEDA on ice concentration, route planning systems can design safer and more efficient paths for vessels, avoiding high-risk areas and significantly reducing the possibility of collisions or unexpected diversions. This not only protects vessels and their crew, but also allows for a considerable savings in time and resources, improving operational efficiency. Other practical applications include climatic studies on the evolution of the state of ice in an area of interest, being another of the main fields of interest in ice analysis.
This approach not only improves safety in the Arctic and other polar regions, but also marks a significant milestone in using artificial intelligence and satellite data to solve real-world problems. By integrating this technology into the SEDA platform, we obtain an advanced tool for the continuous and accurate study of ice conditions.