
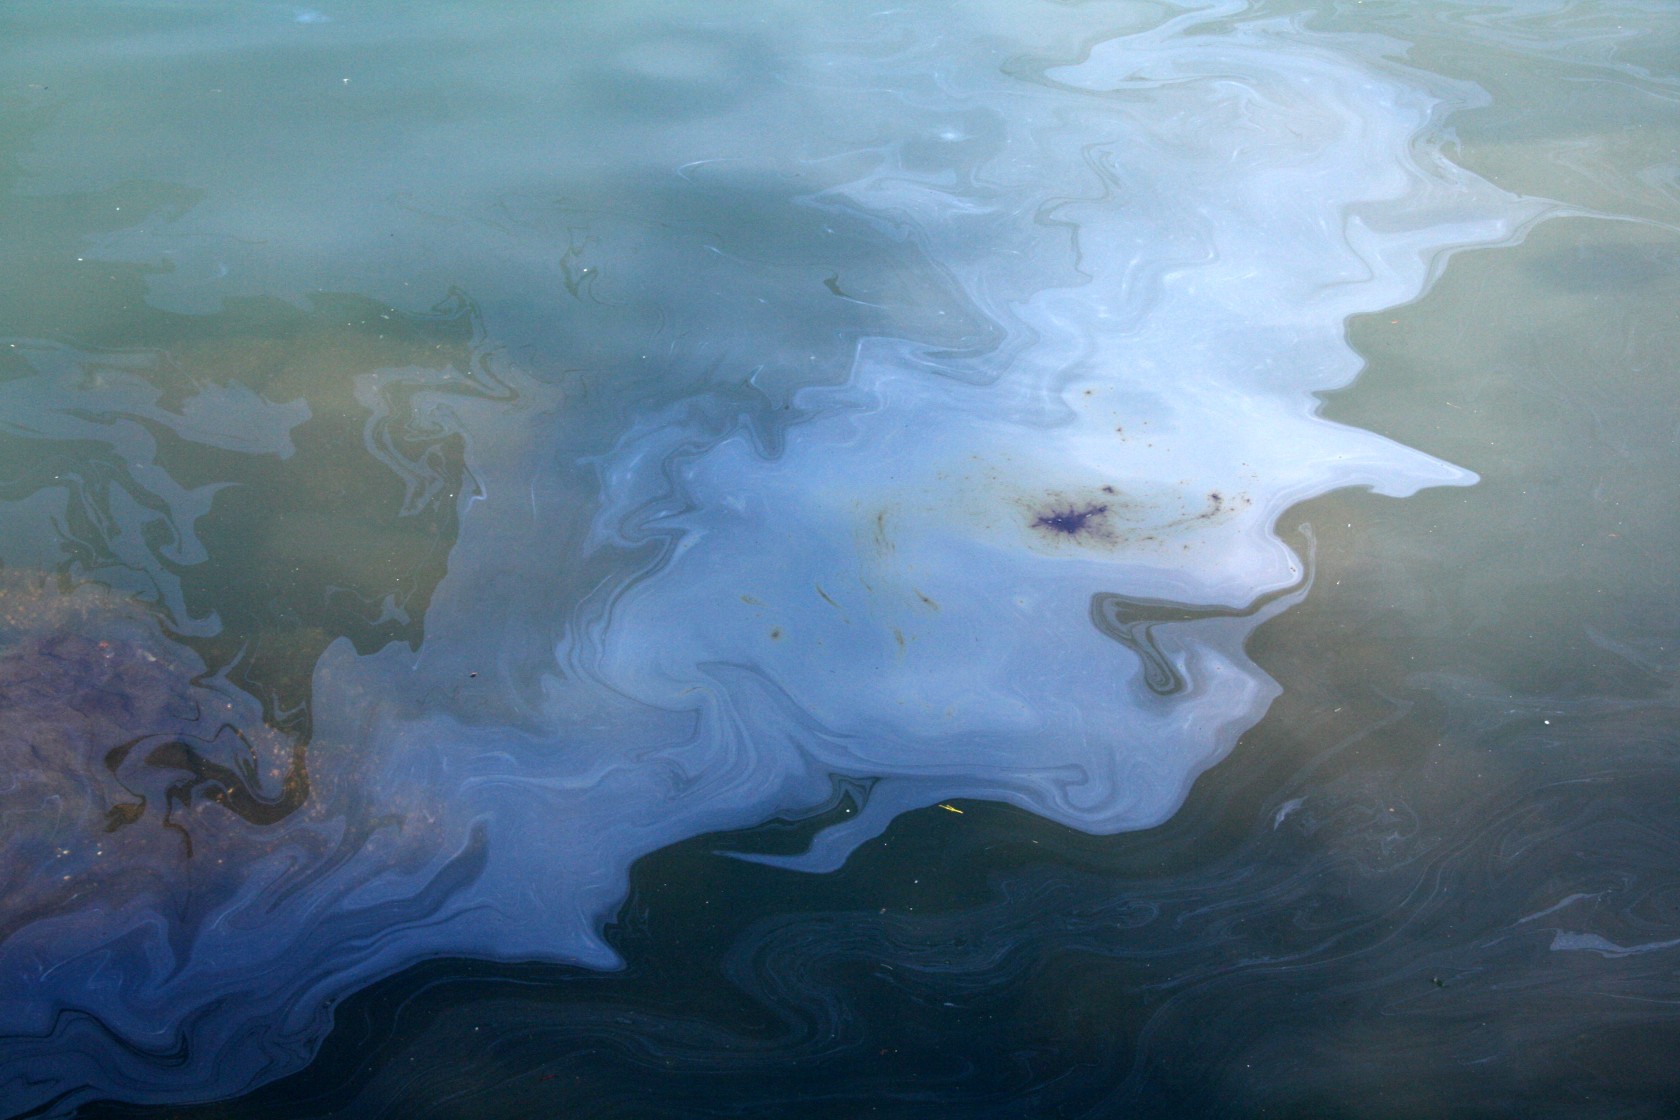
Oil spills at sea represent one of the greatest threats to marine and coastal ecosystems. Detecting them early and accurately is key to reducing their impact and facilitating a rapid response. In this scenario, SEDA addresses this problem using satellite images and Artificial Intelligence techniques, managing to automate the task of monitoring spills.
Workflow
The flow begins with the acquisition of SAR images that allow capturing detailed information of large maritime areas regardless of weather or light conditions. These images are preprocessed to remove noise and highlight relevant patterns. Next, our Deep Learning models based on Convolutional Neural Networks (CNN), analyze the images in search of patterns that may indicate the presence of a spill. Finally, the results are visualized in the GIS system included in SEDA, providing interactive maps and other visualization formats, such as official reports.
At the entrance
The use case is based on SAR (Synthetic Aperture Radar) images, which offer crucial advantages over optical images by providing reliable data under any weather or lighting conditions. This is essential when speed of detection is vital. These images are integrated into the system using standard formats (tiff, jp2, nsif), which facilitates their analysis and processing.
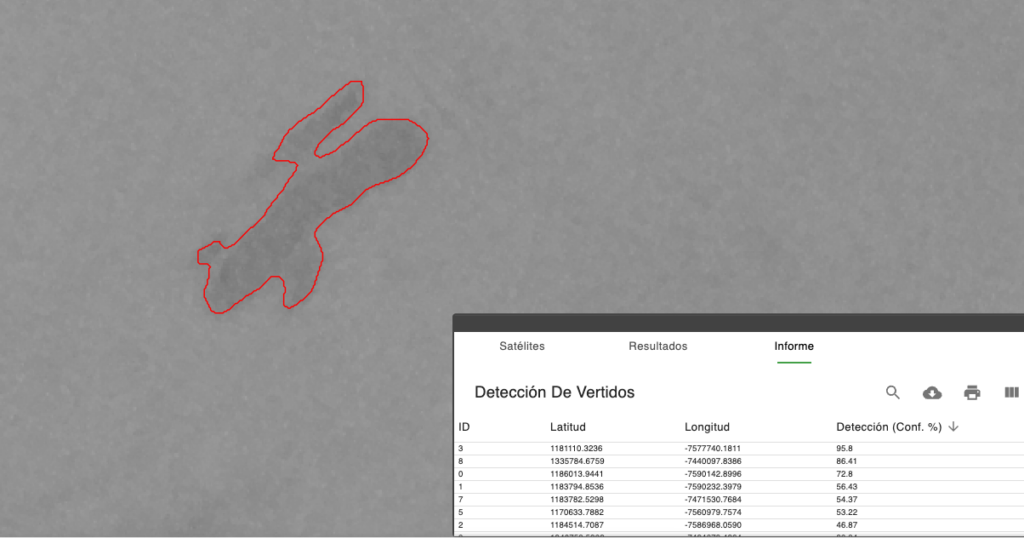
A key challenge in spill detection is differentiating between real spills and those look-alikes, natural or man-made phenomena such as ship wakes, areas with calm winds, algae or disturbances on the sea surface, which can appear as oil slicks in SAR images. These similar patterns make it difficult to distinguish them, so SEDA uses advanced preprocessing techniques and convolutional neural networks (CNN) to analyze the characteristics of the slicks, reducing false positives and improving accuracy.
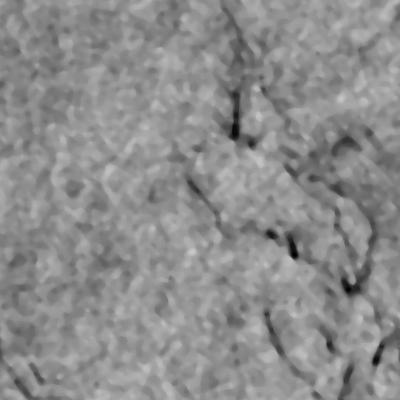
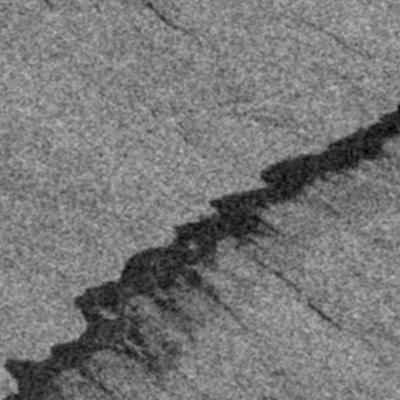
Fig. 2 SAR images obtained from the CSIRO open access dataset (https://data.csiro.au/collection/csiro:57430). The image on the left contains look-alikes, while the one on the right is a spill.
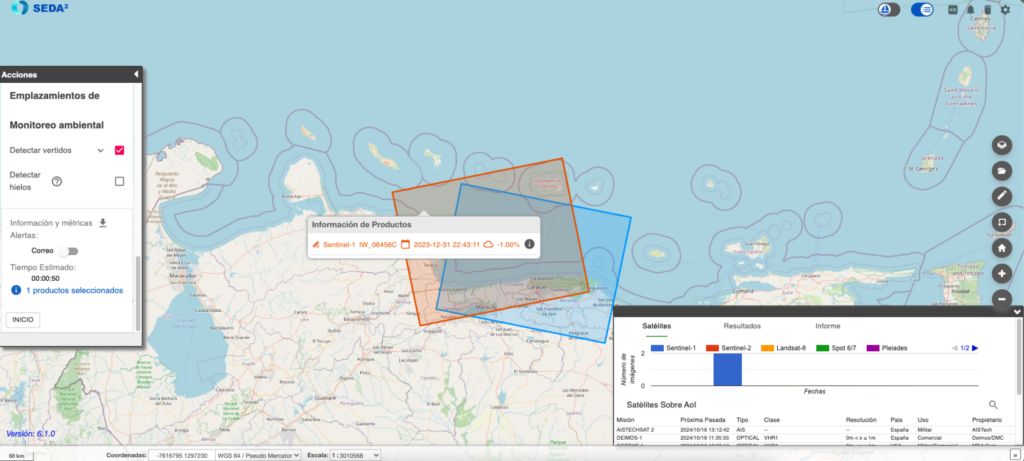
Viewing results
SEDA provides advanced and flexible visualization of the results obtained during spill detection. Operators can access these results through the Geographic Information System (GIS) integrated into SEDA, which presents detailed interactive maps.
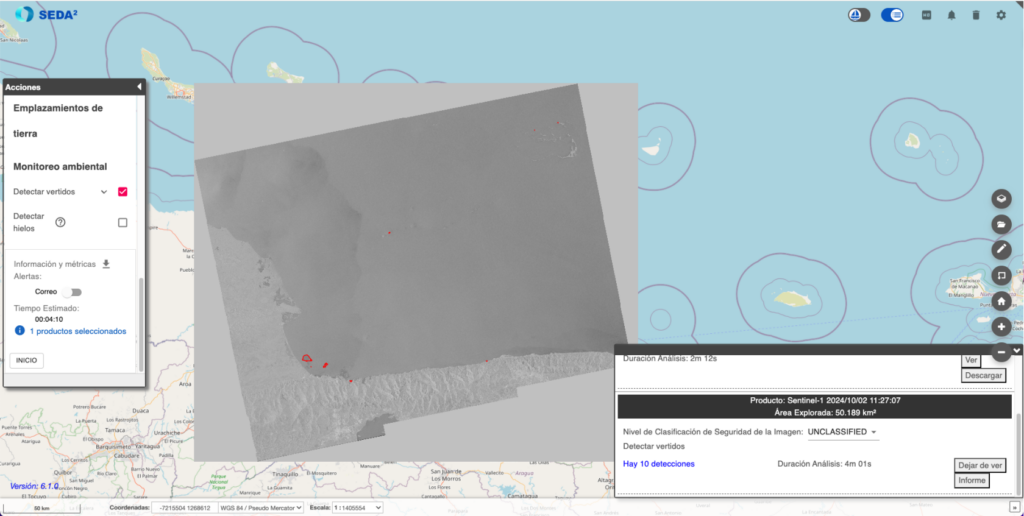
These maps highlight areas affected by oil spills, allowing for rapid identification of critical areas. SEDA's interface allows you to zoom into specific areas, adjust layers of information, and overlay additional data to provide more complete context.
In addition to interactive visualization in the GIS, SEDA generates output reports in a wide variety of formats such as PPT, KML, NVG, shapefiles o geoJSON, as well as other types of official formats used in the NATO environment, such as ISRSPOTREP and RECCEXREP. Se facilita también la imagen analizada convertida a NSIF, formato diseñado para el intercambio de imágenes y datos relacionados en entornos de defensa e inteligencia.
La versatilidad de estos formatos permite la Integration of SEDA results into other platforms and geospatial analysis systems, both civil and military.
Practical Applications
Spill detection has multiple applications. In the field of defense, it can be used to monitor maritime borders and protect areas of strategic interest from potential environmental damage. Likewise, early detection capabilities are valuable for environmental authorities and energy companies, which can respond quickly to incidents and mitigate ecological and economic damage. In addition, this technology can be integrated into contingency plans for spills, optimizing clean-up actions and minimizing long-term repercussions.